AI-Powered ZIP Code Intelligence

Your Real Estate Agent Can't Tell You This.

Federal fair housing laws prevent agents from discussing neighborhood demographics with you — and for good reason. But income trends, population shifts, and economic data are critical to making a smart buying decision. So if you want the full picture, you have to look it up yourself.

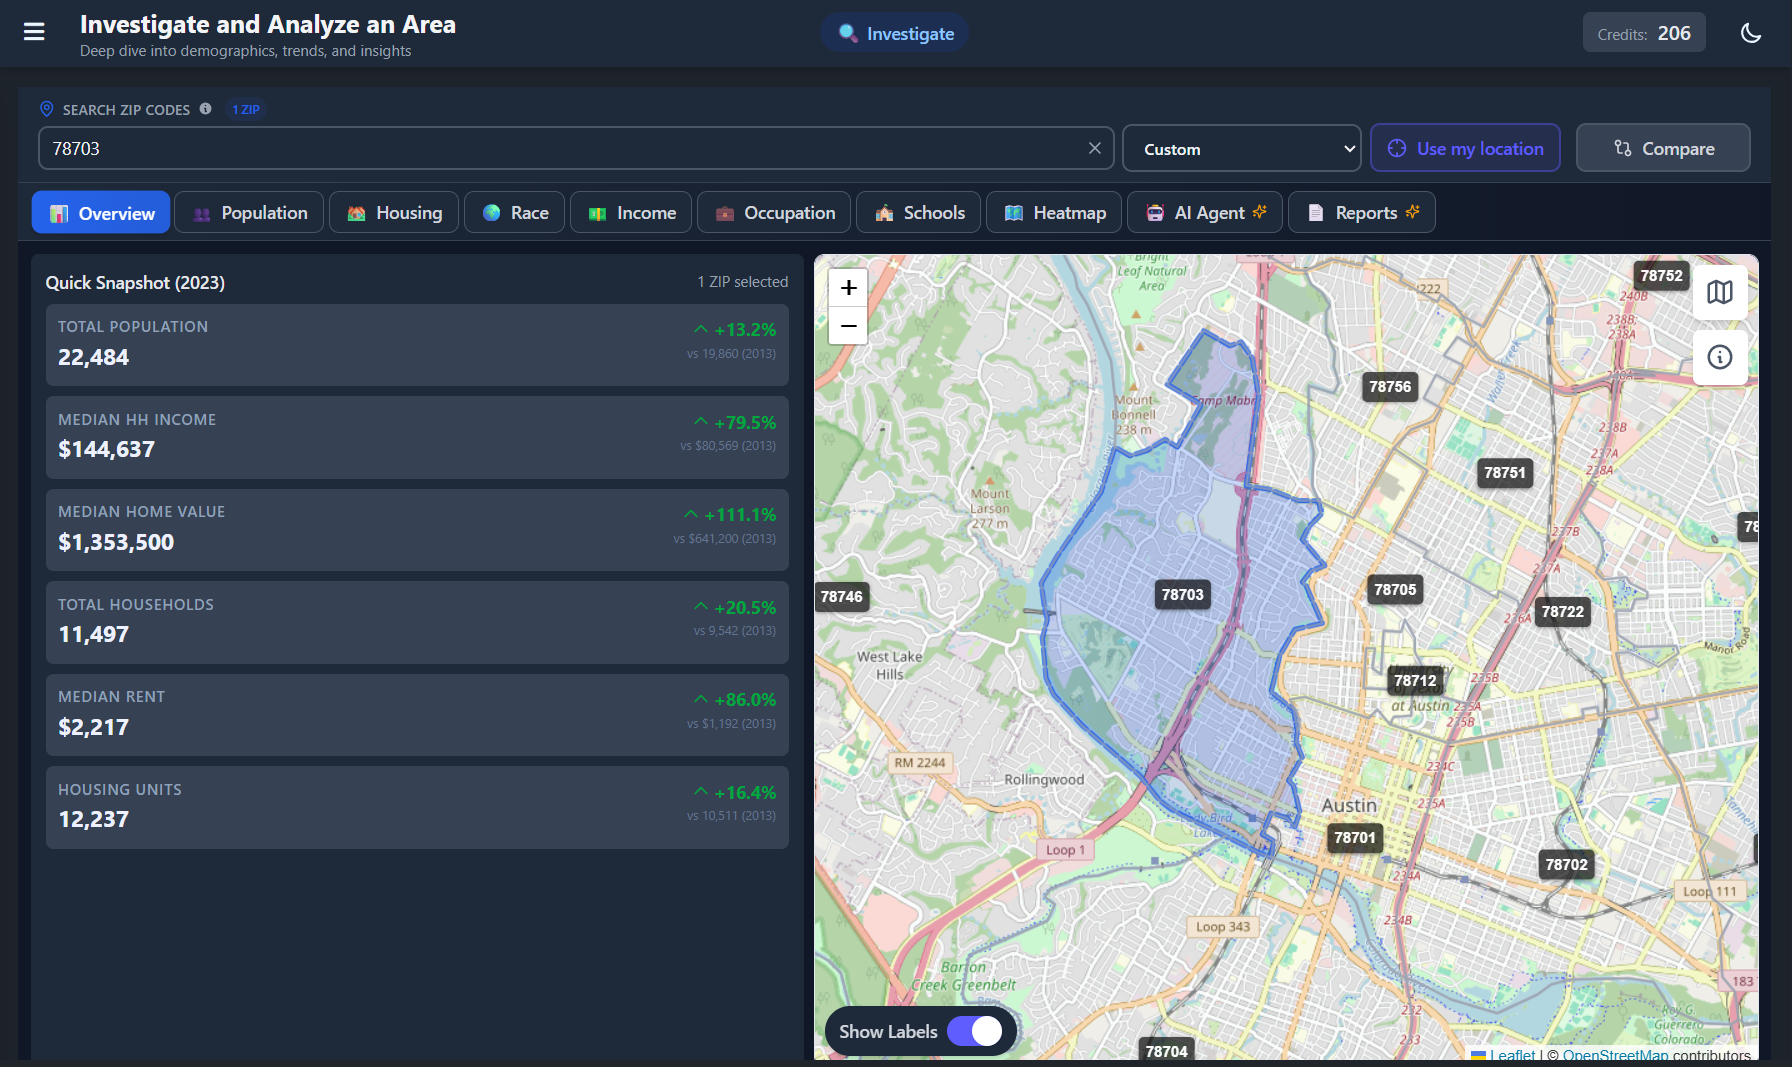
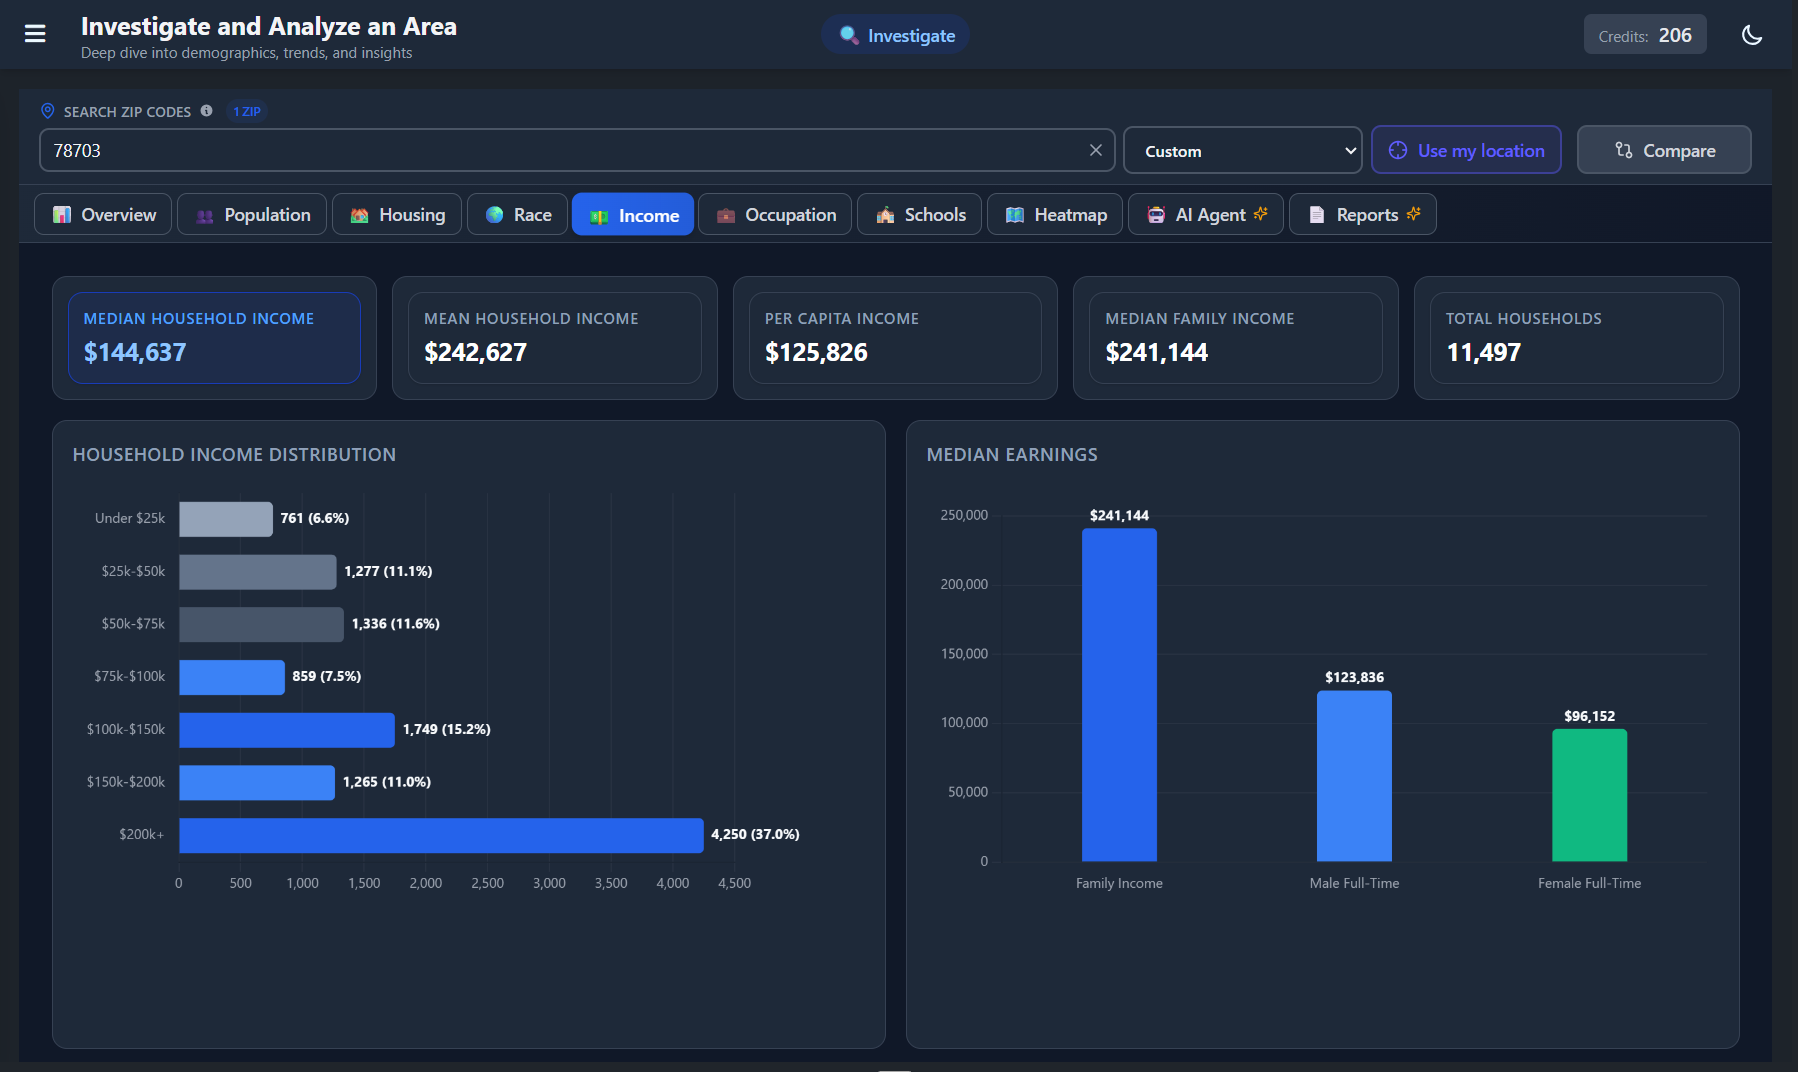
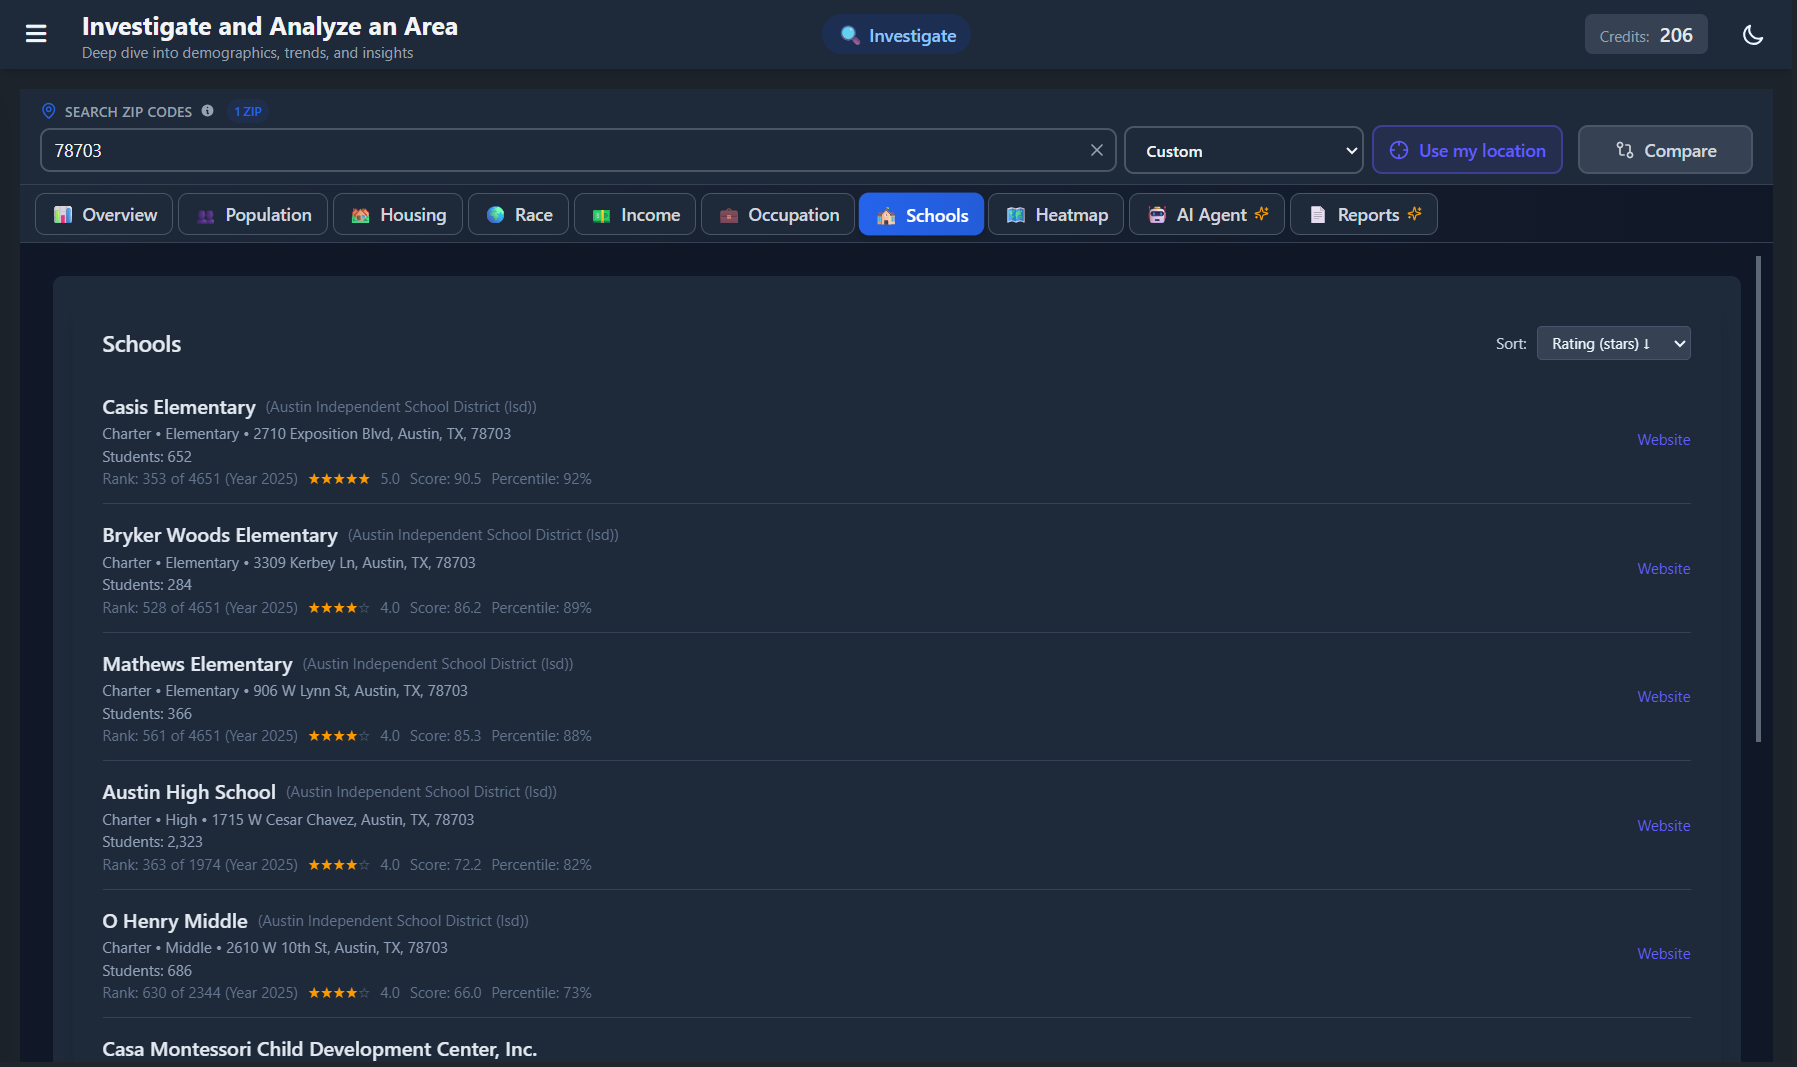
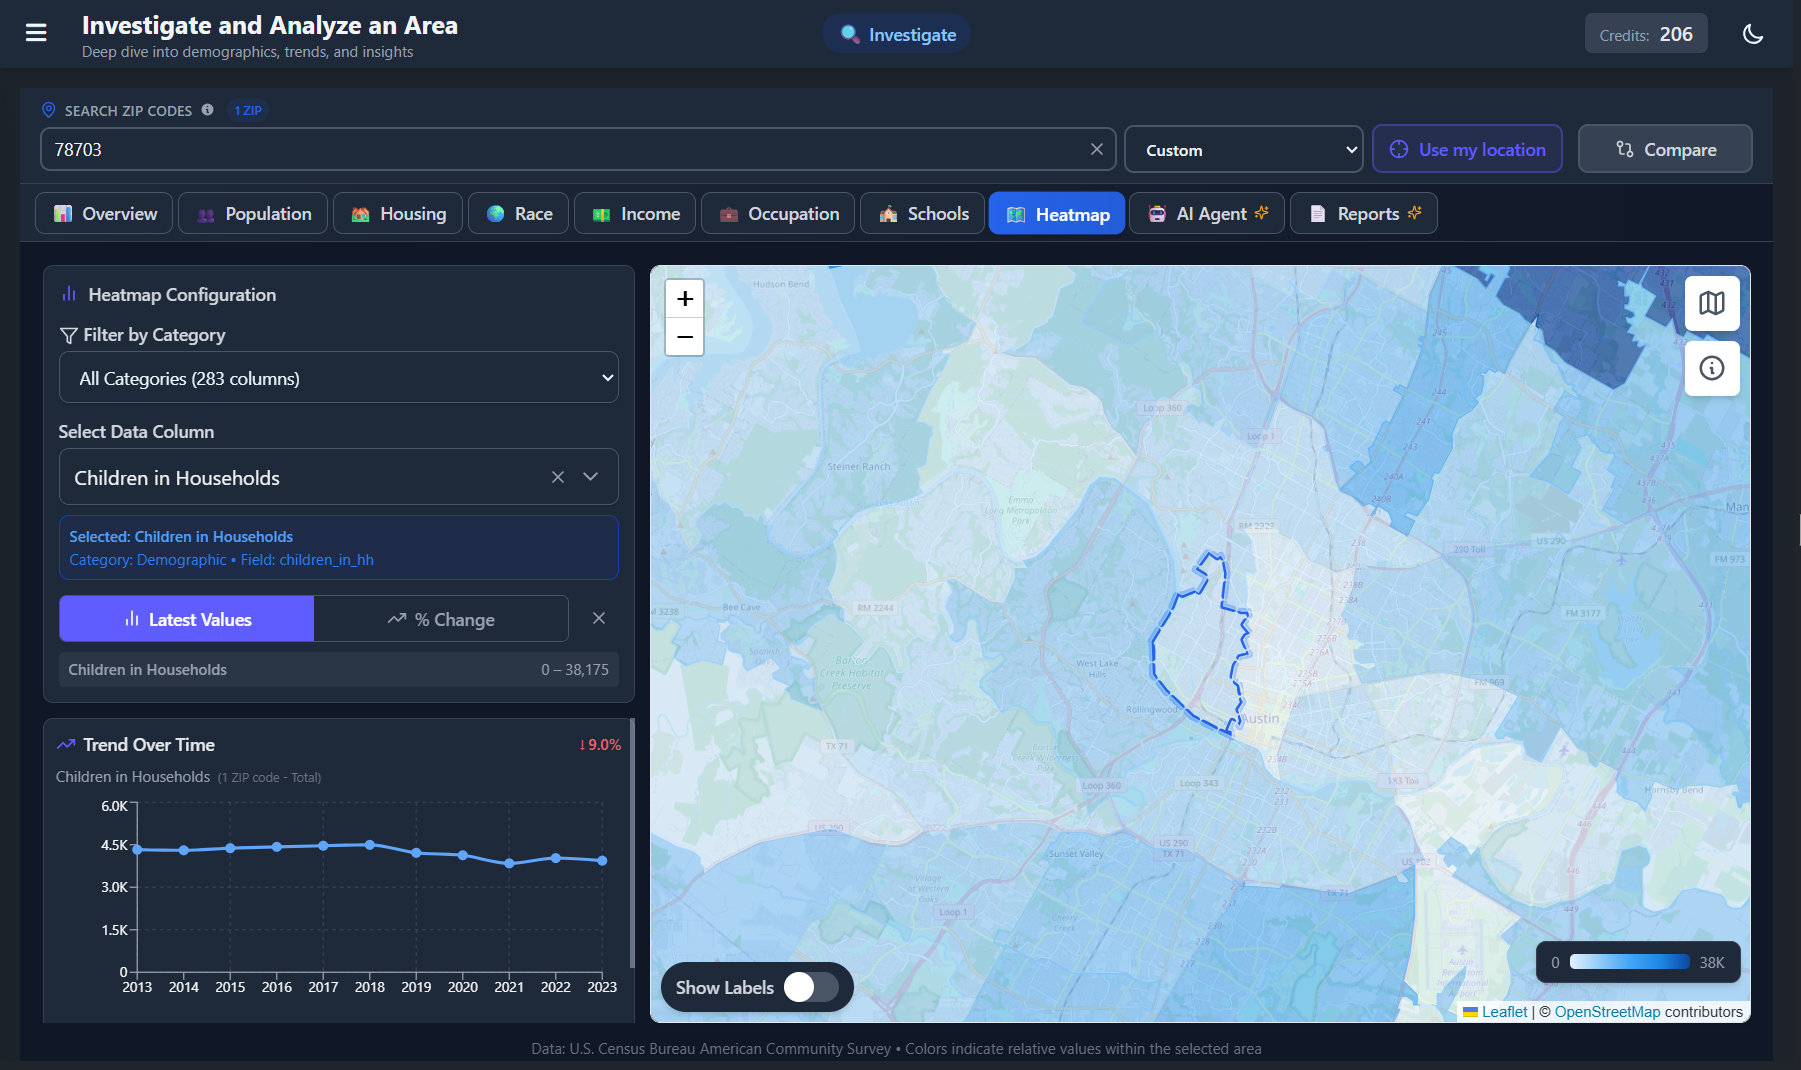
ZipCodeGPT analyzes 200+ census indicators for any U.S. ZIP code and explains them in plain English — so you walk into every deal informed.

Official Census Bureau Data 33,000+ ZIP Codes 200+ Indicators AI-Powered Explanations
zipcodegpt.com/investigate
ZipCodeGPT Dashboard - Interactive map with demographic data and quick statistics for ZIP code 78703

Agents are legally required to stay neutral on demographics. Listing sites show you prices, not fundamentals.

That means nobody is telling you about income growth, migration patterns, population decline, or housing supply trends in the ZIP code you're about to invest your life savings in.

That research is on you. We make it take 30 seconds.

How It Works

Three Steps to Smarter Decisions

Step 1

Search

Enter any U.S. ZIP code to pull up its complete demographic and economic profile.

Step 2

Explore

Browse 200+ indicators, interactive maps, heatmaps, and AI-generated analysis.

Step 3

Decide

Make confident, data-backed decisions on where to buy, invest, or do business.

Product Tour

See What Your Agent Can't Show You

From demographic analysis to AI-powered insights, explore the data that drives smarter decisions.

zipcodegpt.com/investigate
Overview dashboard with map and key statistics

Instant ZIP Code Snapshot

Population, median income, home values, rent, and an interactive boundary map. The basics, in one screen.

  • Total population with growth trends
  • Median household income
  • Median home value & rent
  • Interactive map with ZIP boundaries
zipcodegpt.com — Income
Income and housing analysis

Income & Housing

Household income distribution, median home values, rent levels, owner-vs-renter split, vacancy rates — and how they've changed over 10 years. This is the data that tells you whether an area is rising or stalling.

  • Income distribution & trends
  • Home values & median rent
  • Owner vs renter occupancy
  • Vacancy rates & housing types
zipcodegpt.com — Schools
School ratings and information

Schools

School quality is one of the top drivers of home values. See ratings, enrollment, and nearby options for any ZIP code — the data families search for most.

  • School ratings & rankings
  • Elementary, middle & high schools
  • Student enrollment numbers
  • Direct links to school websites
zipcodegpt.com — Heatmap
Interactive heatmap visualization

Regional Heatmap

Visualize any of 283 metrics across an entire region. Color-coded, 10-year trends, percentage changes. Patterns that would take hours to find in raw data jump out in seconds.

  • 283 data columns to visualize
  • Color-coded regional comparisons
  • 10-year trend analysis
  • Percentage change views
zipcodegpt.com — AI Agent
AI-powered analysis and chat

AI Agent

Ask anything. "Is this ZIP improving or declining?" "What are the income trends here?" "Compare this area vs. the one across town." The AI answers using actual census data — not vibes.

  • Natural language questions
  • Data-backed explanations
  • Quick-action prompts
  • Conversation history

Built for people who do their own research.

Homebuyers

Who want the full picture before making an offer

Investors

Analyzing markets for high-performing locations

Business Owners

Choosing the right location for their next move

Digital Marketers

Targeting audiences with demographic precision

Pricing

Simple Pricing

Each credit = one ZIP code analysis. Start free, upgrade when you need more.

Need raw data instead? Check out our complete census dataset

Free Trial

Perfect for exploring our platform

$0 /month

  • 50 free credits upon signup
  • AI Summary reports
  • AI chat conversations
  • View ZIP code data & maps
  • Limited report types (no Real Estate ROI, Schools, or Custom reports)
Most Popular

Standard

For regular census data analysis

$19 /month

$190 /year (Save $38)

  • 50 ZIP code analyses per month
  • All AI report types:
  • ✓ AI Summary reports
  • ✓ Real Estate ROI Analysis
  • ✓ Schools & Education reports
  • ✓ Custom Analysis queries
  • AI chat conversations
  • Credits accumulate & never expire

Premium

For power users and teams

$29 /month

$290 /year (Save $58)

  • 100 ZIP code analyses per month
  • Everything in Standard plan
  • Priority processing queue
  • Priority email support
  • White-label reports — your logo & branding
  • Credits accumulate & never expire

All plans include: AI-powered insights, Interactive chat, Data visualizations, 3-month grace period

Need more credits? Purchase additional credit packages anytime.

For Data Scientists & Researchers

Need the Raw Data?

Our complete U.S. Census dataset covers 33,000+ ZIP codes, 283 fields, 11 years (2013-2023). One-time purchase, lifetime access.

$499
one-time purchase
Learn More
360K+
Data Rows
33K+
ZIP Codes
283
Data Fields
11
Years (2013-2023)

Frequently Asked Questions

Why can't my agent just tell me this stuff?

The Fair Housing Act prohibits real estate agents from discussing the demographic composition of neighborhoods with buyers. This law exists to prevent discriminatory steering — directing buyers toward or away from areas based on race, religion, or other protected characteristics. It's an important protection. But it also means that if you want to understand the economic and demographic fundamentals of where you're buying, you need to research it independently. ZipCodeGPT makes that easy.

How is this different from Zillow or Redfin?

Listing platforms show properties and prices. ZipCodeGPT shows you what's driving those prices — population growth, income trends, migration patterns, employment shifts, housing supply. It's the layer underneath the listings that tells you where things are headed.

What data does ZipCodeGPT use?

Official U.S. Census Bureau and American Community Survey (ACS) data, 2013-2023. Over 200 indicators per ZIP code — the same public data used by government agencies and institutional investors. Updated as new releases come out.

What kind of questions can I ask the AI?

You can ask questions like: 'Is 78701 a good long-term hold?', 'What risks should I know about 33139?', 'Compare rental potential in 85281 vs 85251', or 'Which ZIP codes near Dallas have the best income growth?' The AI provides data-backed answers using official census data.

Can I compare multiple ZIP codes side-by-side?

Yes! Our comparison tool lets you analyze multiple ZIP codes head-to-head across income growth, population changes, housing metrics, employment trends, and more. See exactly which location offers better potential and understand the data behind the differences.

Can I put my own branding on the reports?

Yes! Premium subscribers can add their company name, logo, and website to every PDF report. Your clients see your brand, not ours — perfect for real estate agents who want professional, branded neighborhood reports to share with buyers and sellers.

What's included in the free trial?

50 credits to analyze any ZIP code, generate AI reports, compare locations, and chat with the AI agent. No credit card required.

Latest ZIP Code Analysis

AI-powered demographic insights for U.S. ZIP codes

Your agent can't tell you. Listing sites won't show you. Look it up yourself.

Analyze Any ZIP Code Free

50 free credits · No credit card required

Or explore the complete census dataset

Official Census Bureau Data 10+ Years Historical Data AI-Powered Analysis